TRACE SAMPLES
Here are a range of real signals taken from 20m QSOs as received with screen captures from K4CY’s Logger32. The IMD noted on the images are calculated by Logger32.
This capture method provides a useful relative reference.
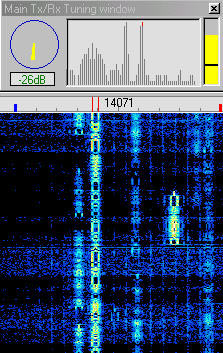
GOOD QUALITY TRANSMISSION
The first image shows a range of signals, with the chosen signal in the waterfall highlighted between the two red parallel lines, just to the left of the text “14071”.
The spectrum display shows the clean profile of this signal, attaining an IMD figure of -26dB.
This trace would rate a Q9 report according to the reporting tables.

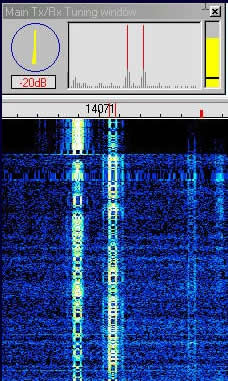
TYPICAL QUALITY TRANSMISSION
Here is a range of signals, with the chosen signal in the waterfall highlighted between the two red parallel lines, just to the right of the text “14071”.
The spectrum display shows one pair of unwanted sidebands, attaining an IMD figure of -20dB.
This trace would rate a Q7 report.

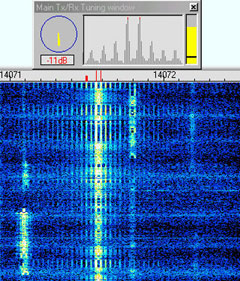
POOR QUALITY TRANSMISSION
This image demonstrates a bad signal that is generating multiple sidebands, taking up more bandwidth than necessary, and likely causing interference to fellow amateurs.
The spectrum display clearly shows the multiple unwanted sidebands emitting from this station.
This trace would rate a Q1 report.

